Features Analysis
An overview of the dataset
Before we start our data story, we need to take a look at the language composition of the dataset. Since alters in this dataset are not randomly sampled, we only consider egos in this section. We also filter out some inactive users who haven't posted any tweets or do not have followers in order to get the language composition of the data.
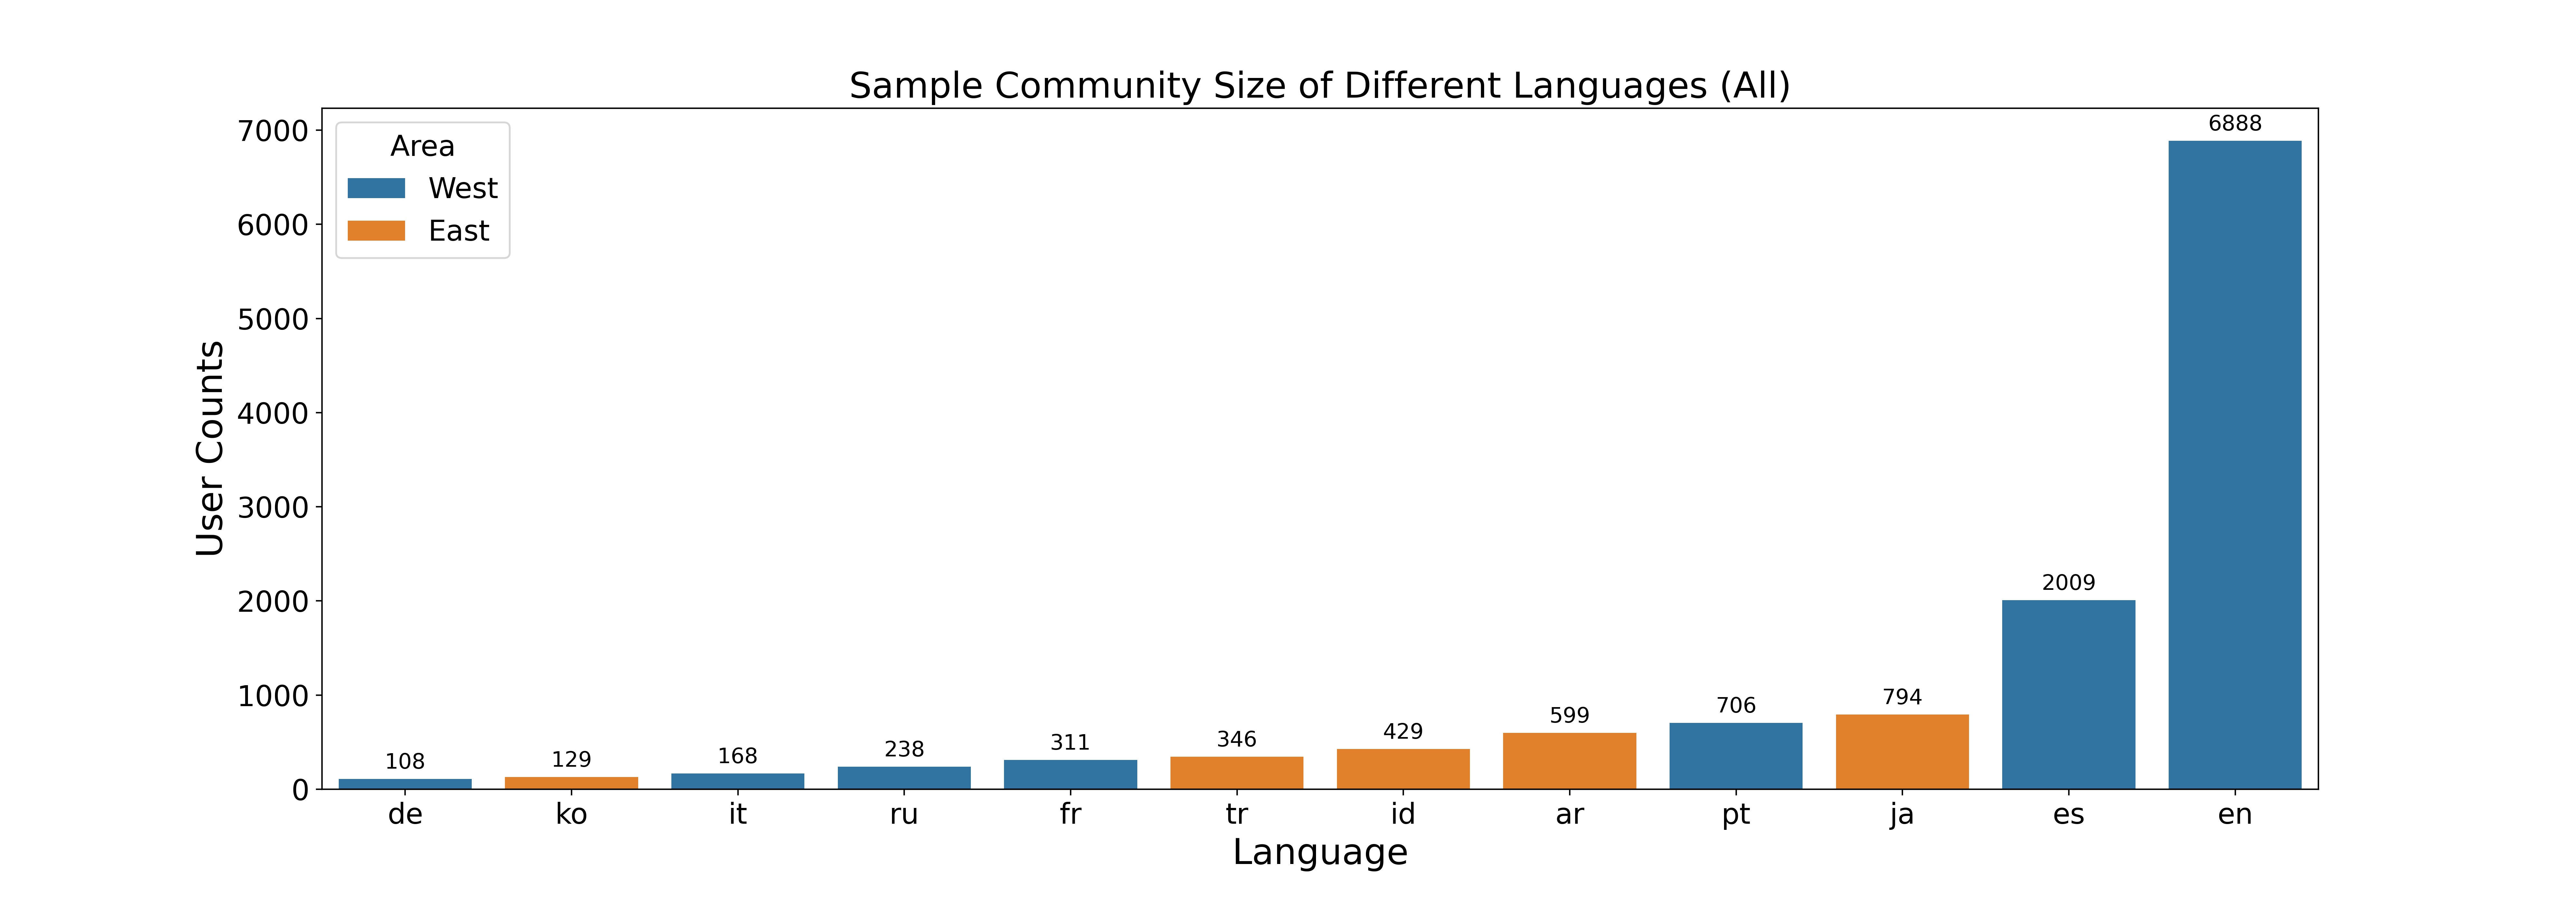
There are 7 western languages and 5 eastern languages in our refined dataset, which have 10,428 and 2,297 users respectively. From the figures, we learn that there is a very high majority of English users, and the top 3 languages (English, Japanese, and Spanish) constitute almost 75% of the total users. Furthermore, among eastern languages, Japanese users form the majority.
Who is more popular?
To address this problem, we must first understand the definition of 'friends' in our dataset. Friends are an ego's followers that have been mentioned by the ego at least twice. The box-plots below show the number of the followers and the friends among different languages, and the barplots show the mean value of followers and friends among different languages.
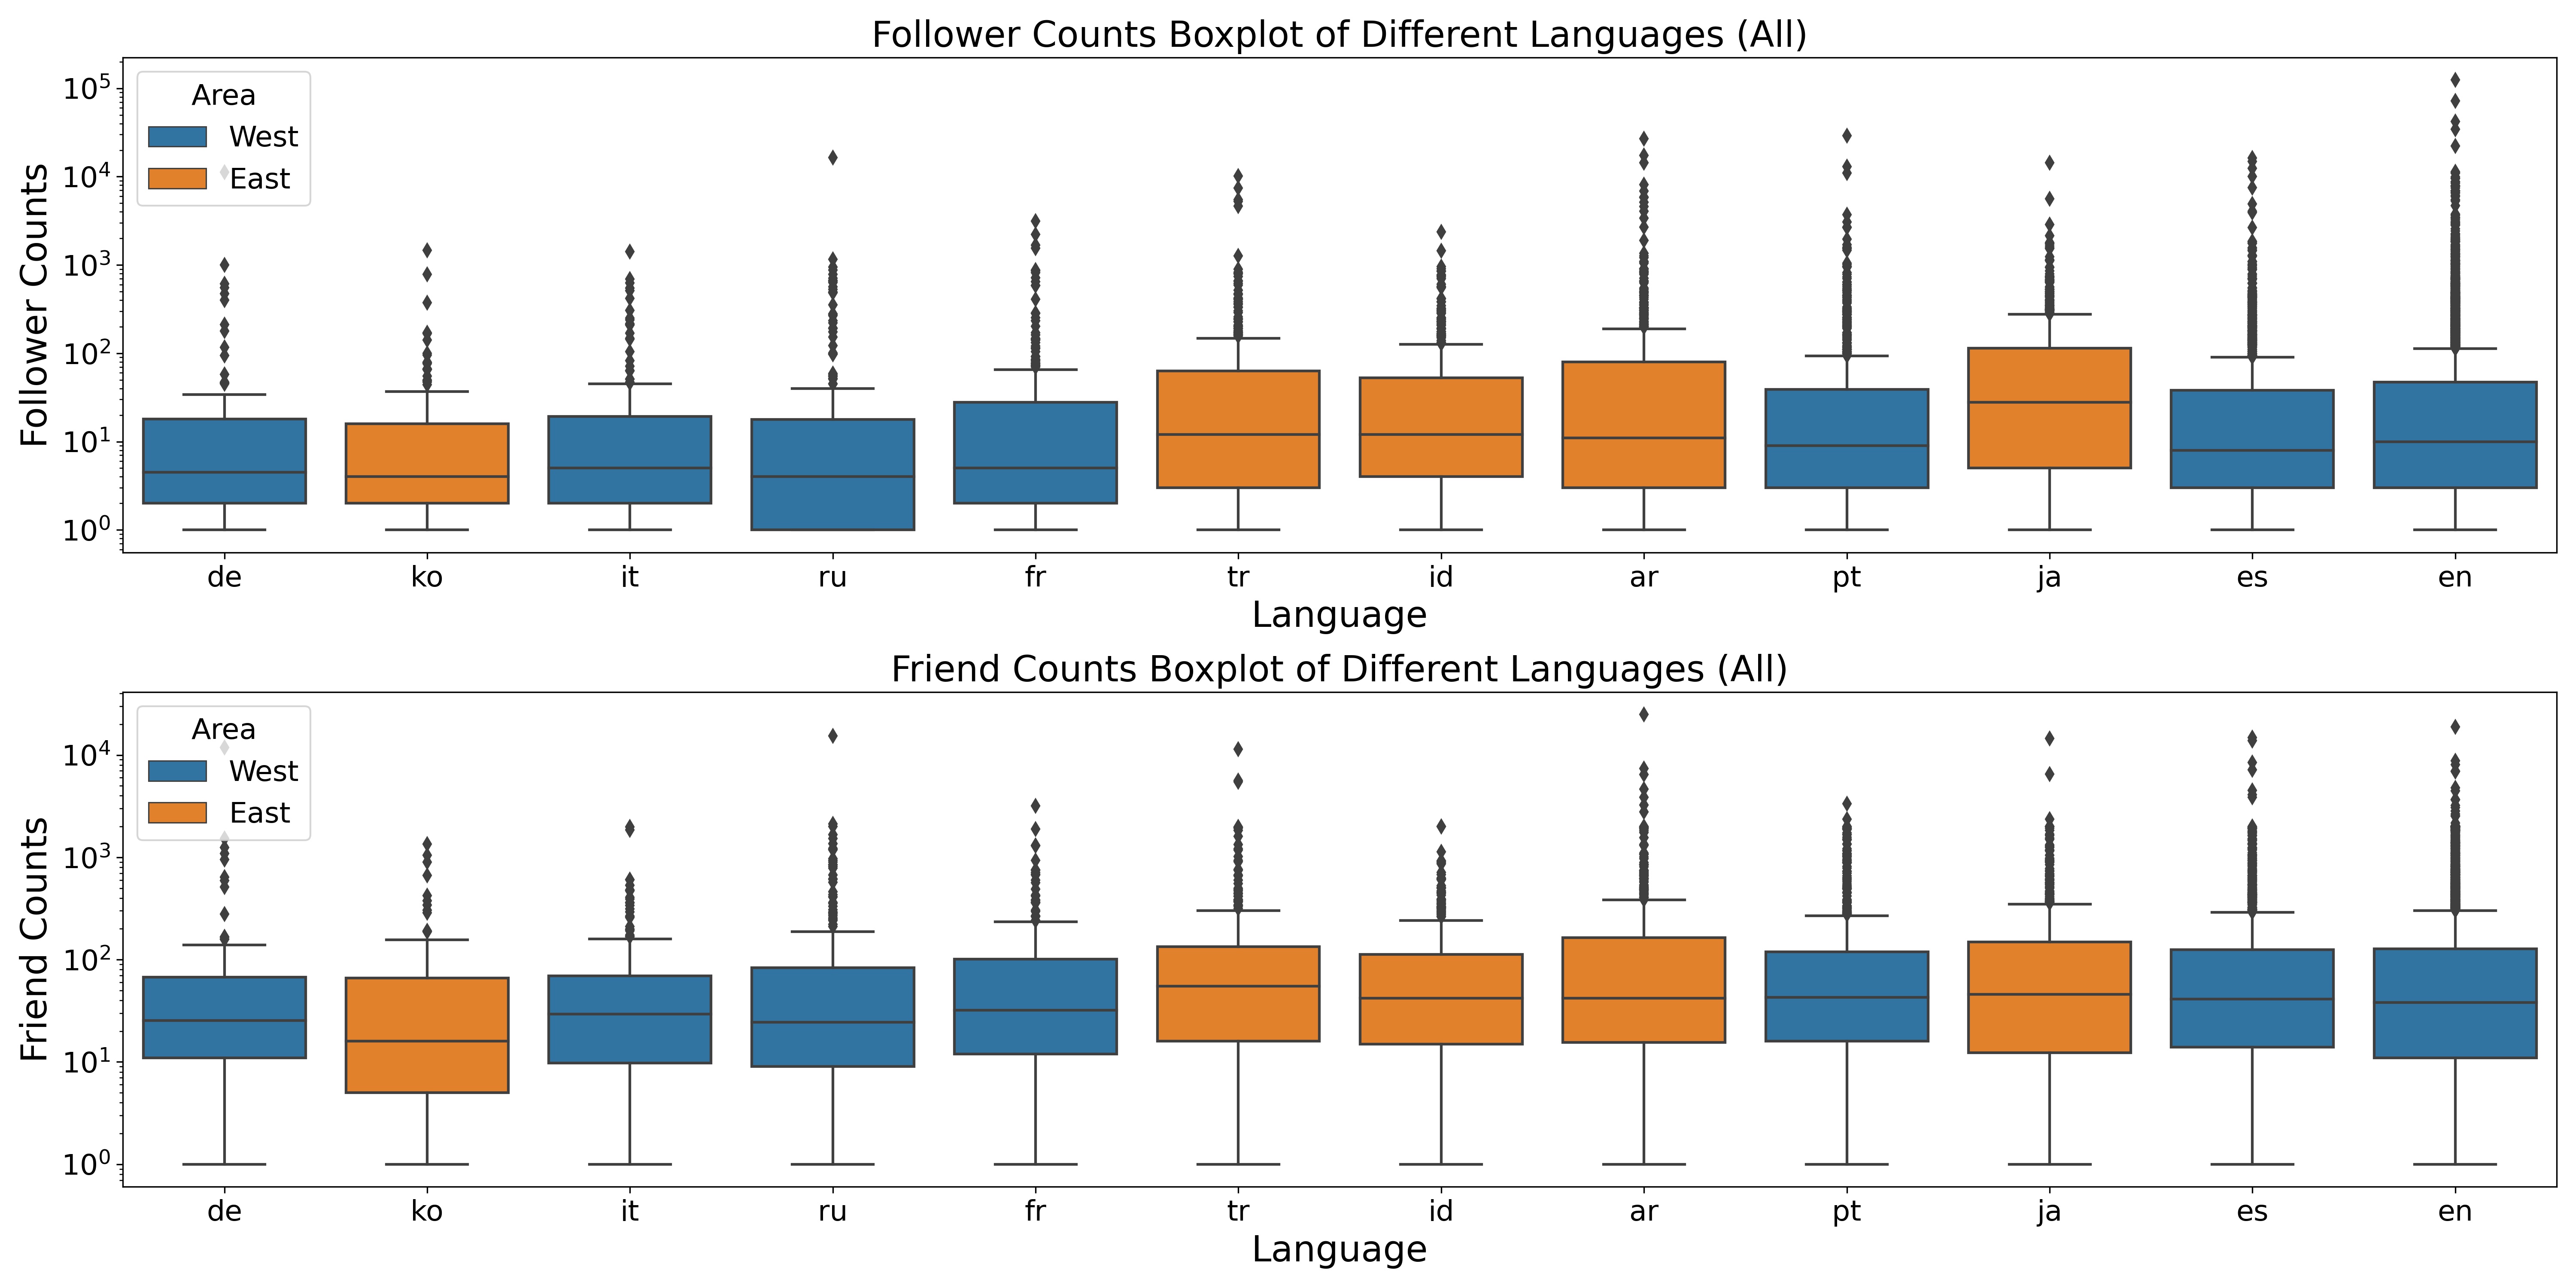
From the plots, the following statistical results are clearly observable:
1. The maximum average number of followers belong to Arabic.
2. The minimum average number of followers belong to Korean.
3. The maximum average number of friends belong to Arabic.
4. The minimum average number of friends belong to Korean.
Arabic language users are quite popular online, while korean language users tend to have less online presence.
Switching to a cultural perspective, do the users from the western culture really have higher popularity than users from eastern culture on Twitter? To answer this question, we group the data by culture according to the languages spoken in both regions.
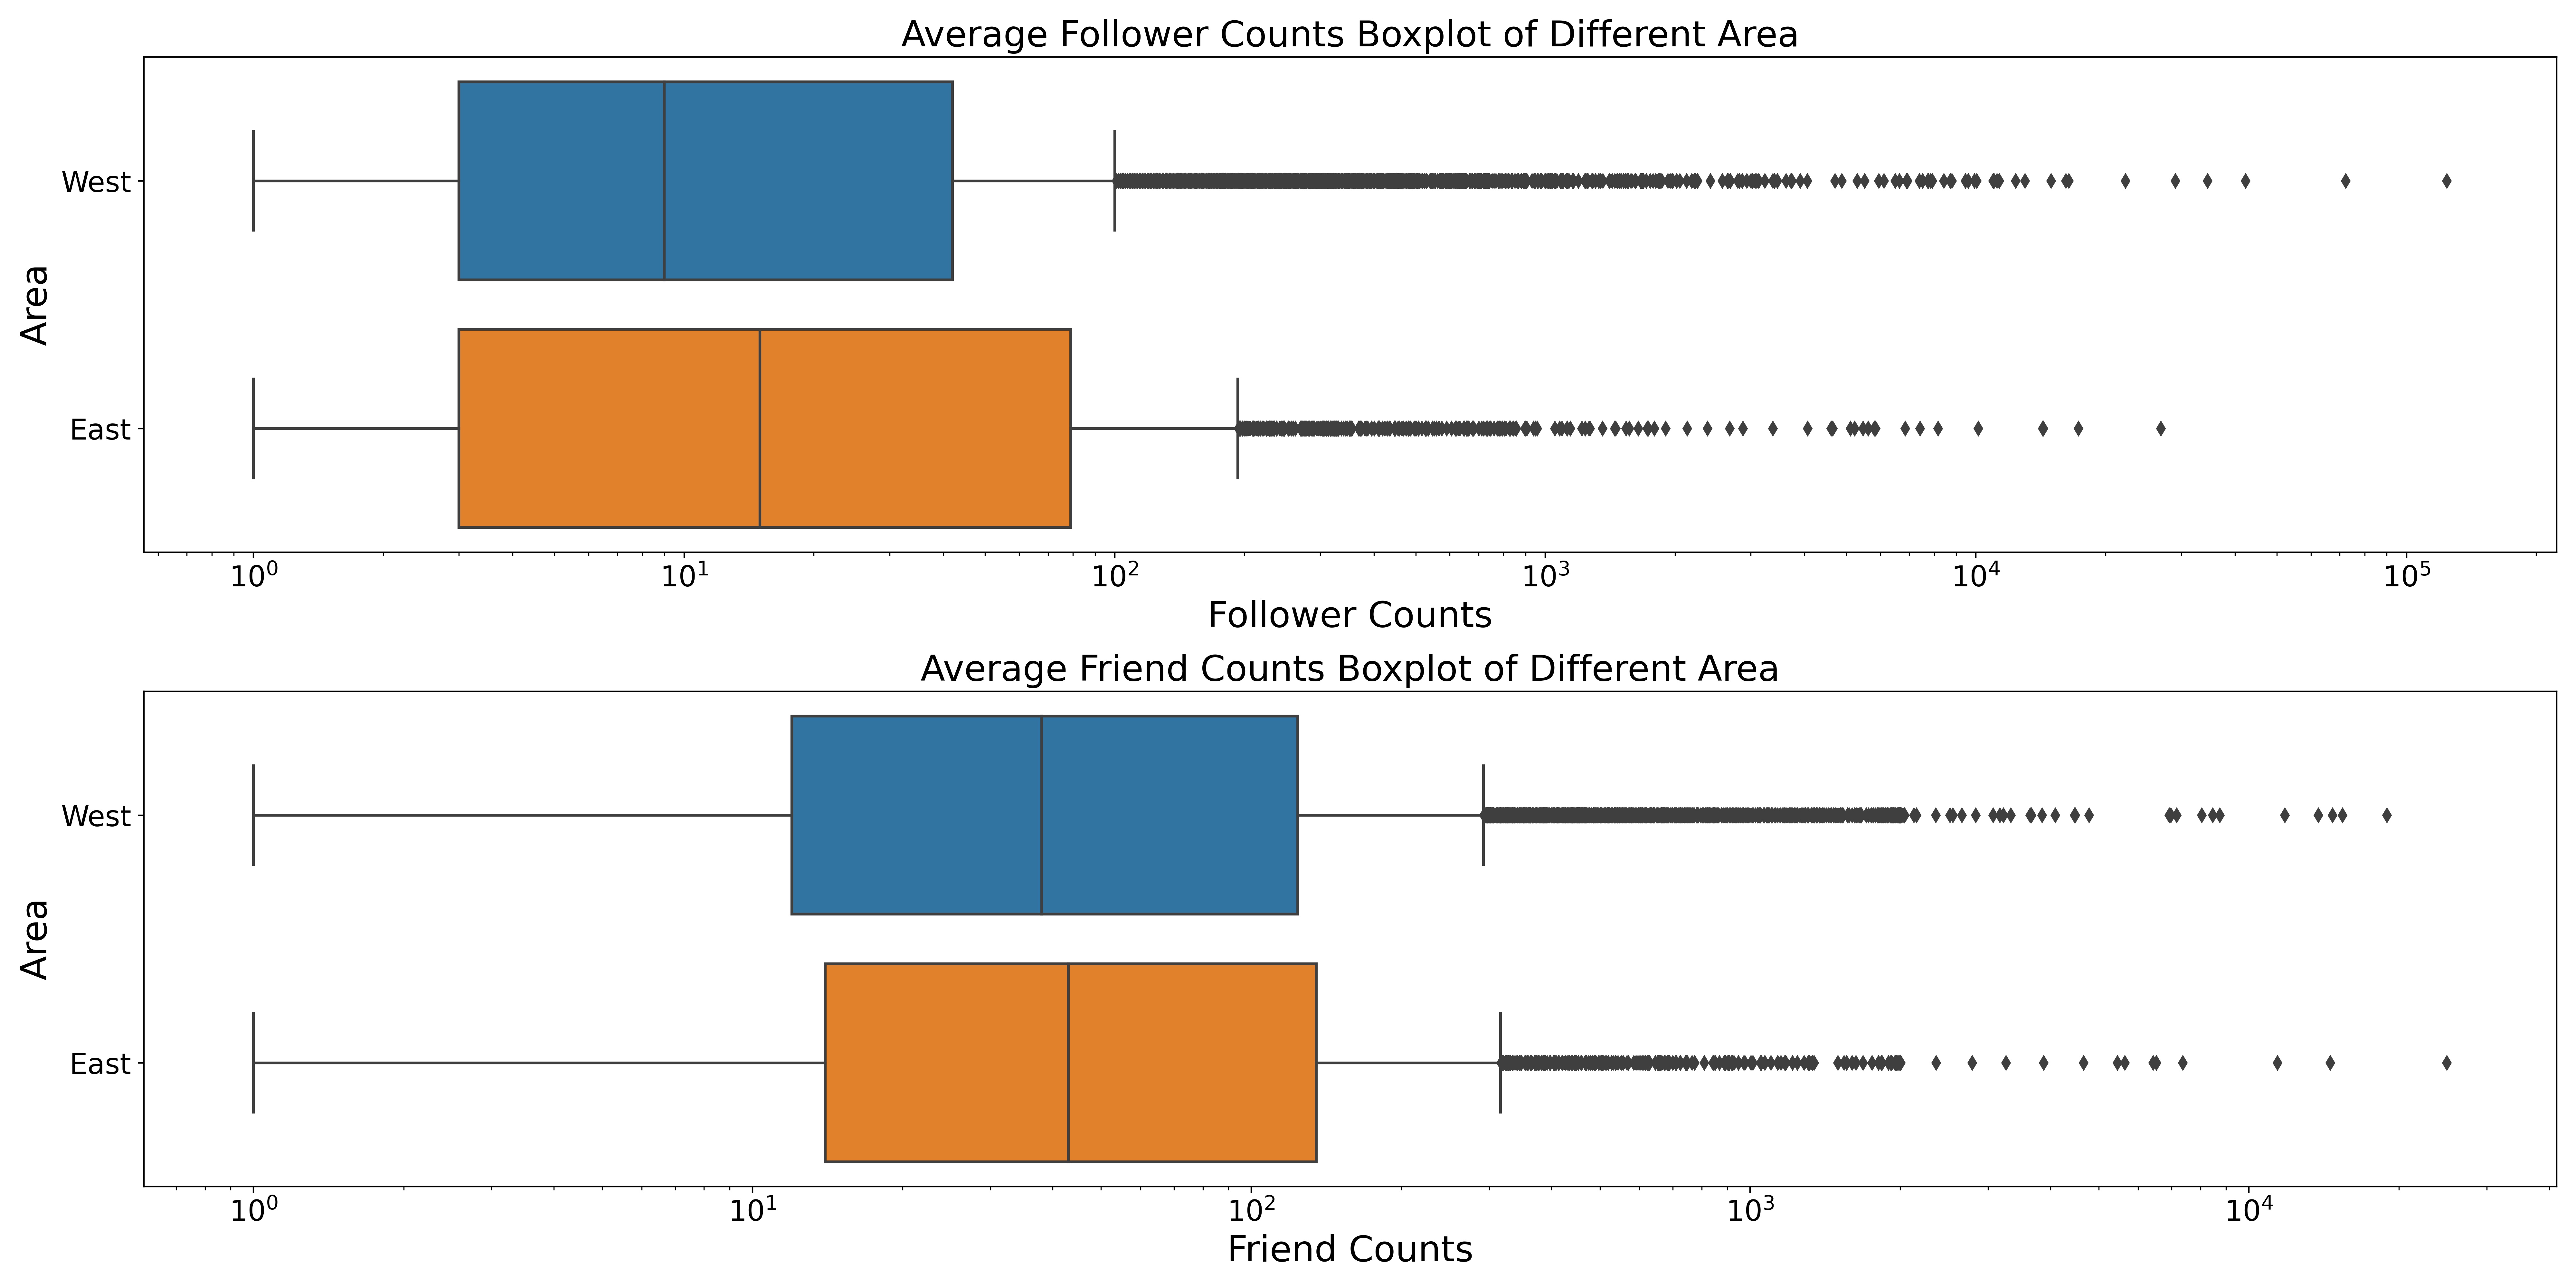
Surprisingly, the results show that eastern culture users have more followers than western culture users, while both the cultures have similar number of friends.
Who is more active?
First, We define the activeness using two features - total tweets counts and average daily tweet counts. The box-plots below show the number of total tweets and daily tweets among different languages, and the barplots show the mean value of total tweets and daily tweets among different languages.
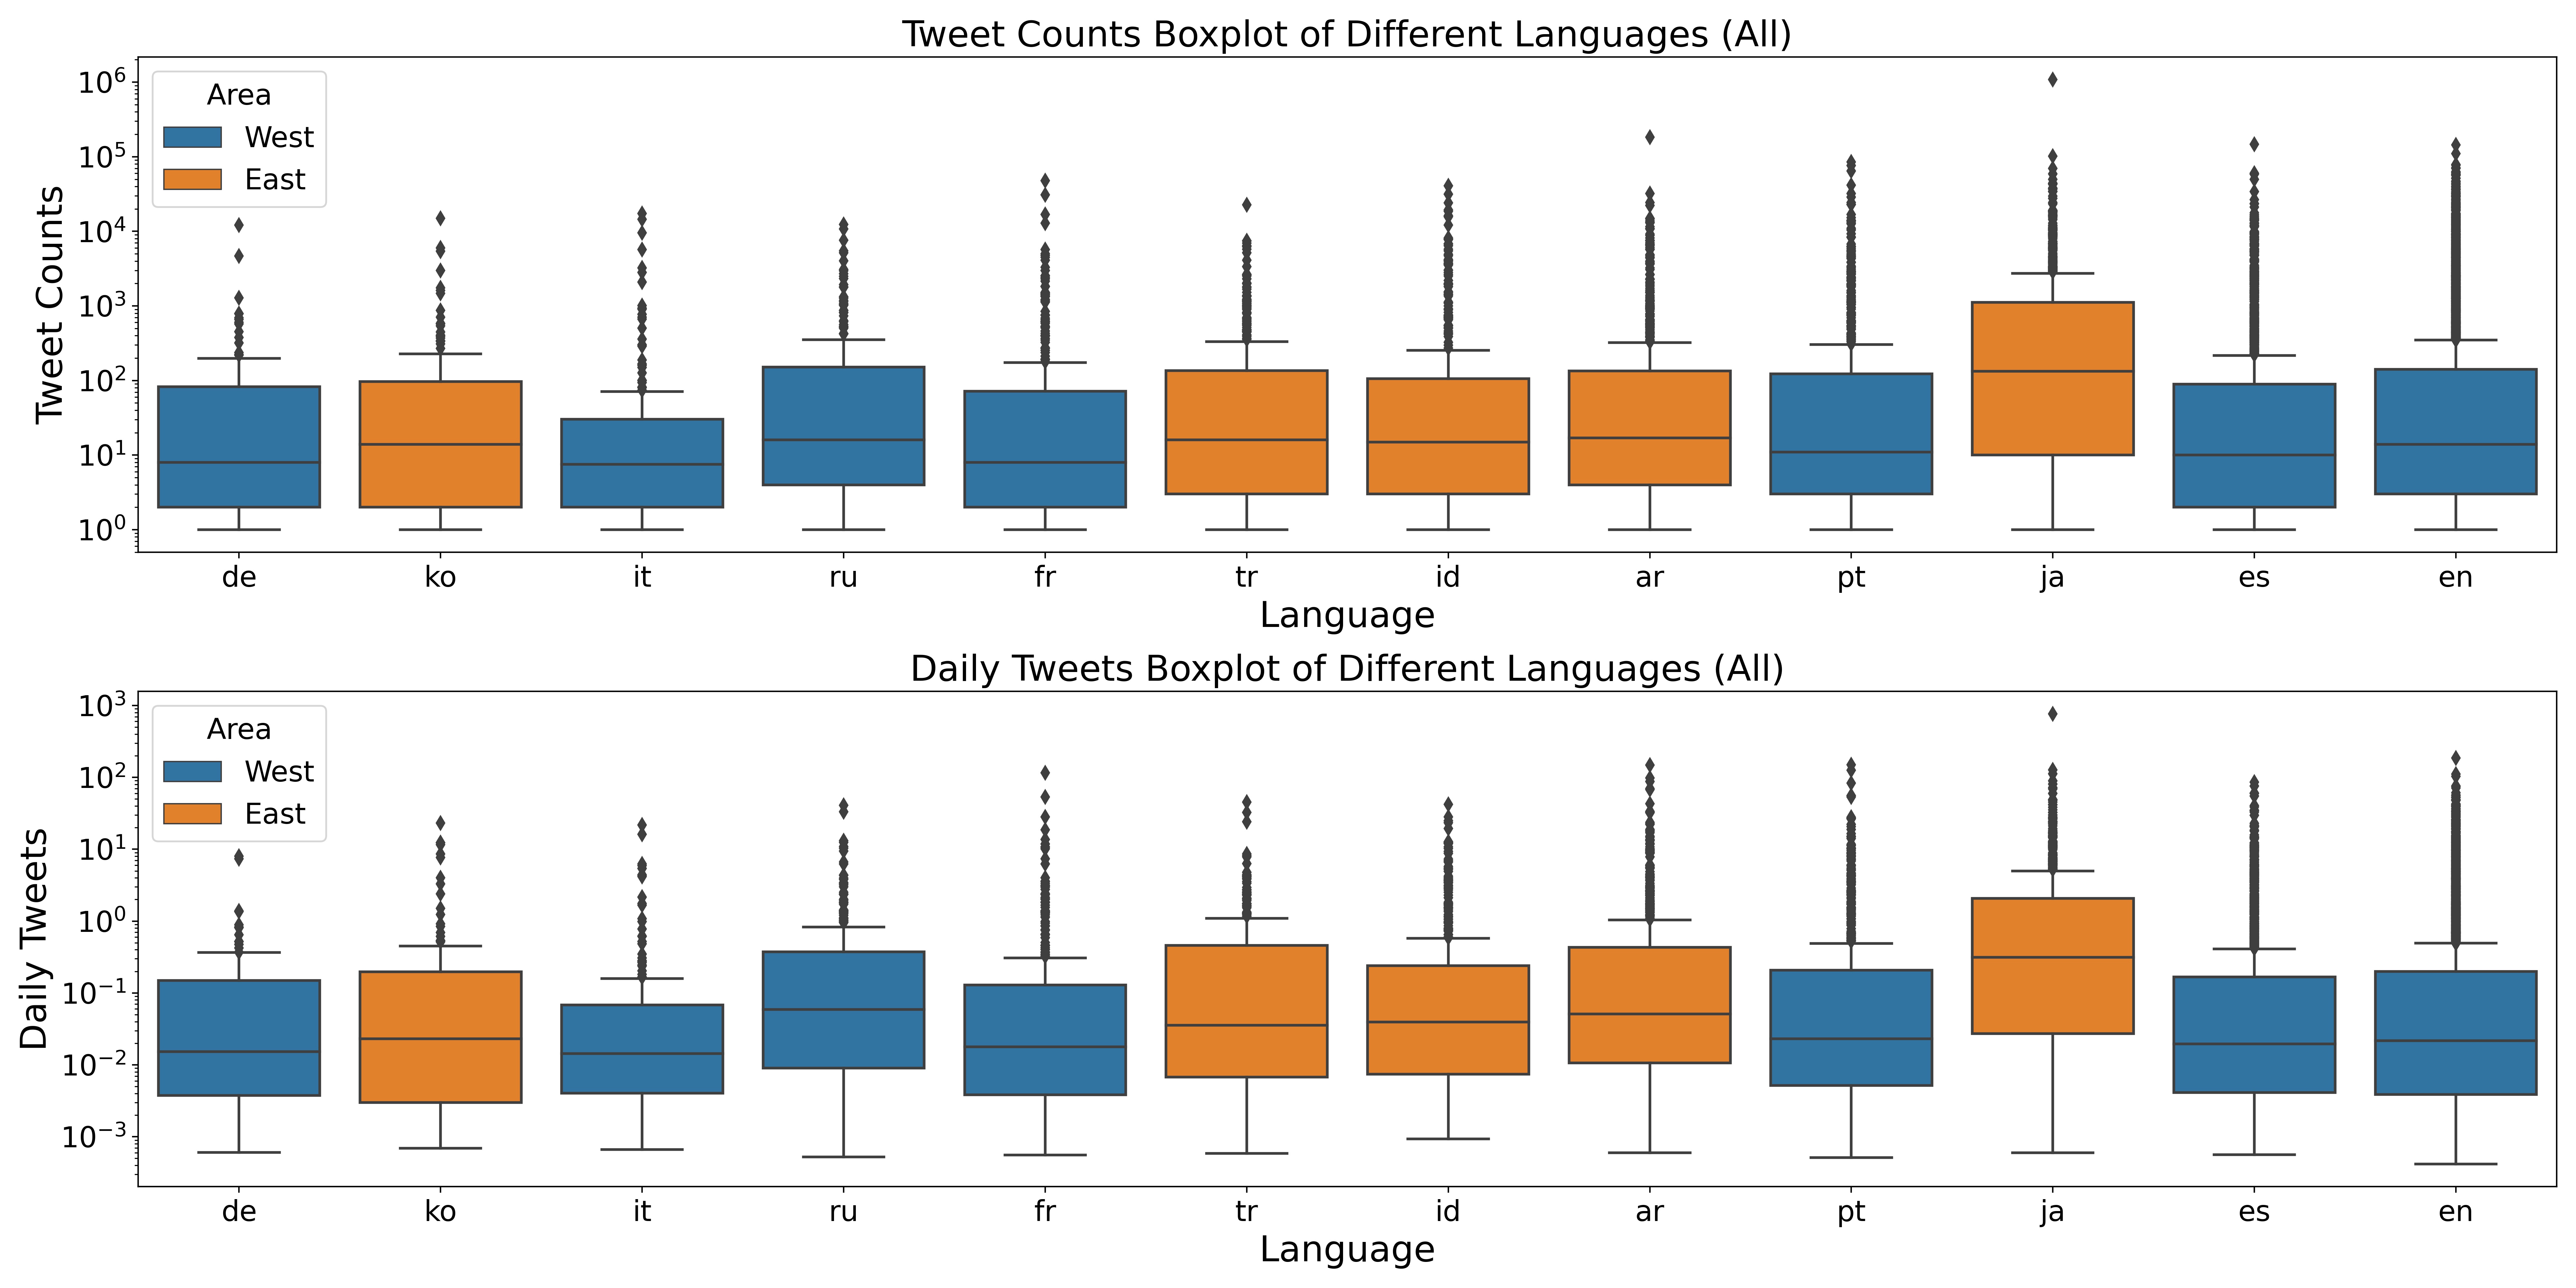
From the plots, the following statistical results are clearly observable:
1. The maximum average number of statuses belong to Japanese.
2. The minimum average number of statuses belong to Germany
3. The maximum average number of daily tweets belong Japanese.
4. The minimum average number of daily tweets belong to Germany
Japanese language users spend more time on Twitter, while Germany language users tend to be less active online.
We also analyze it from a cultural perspective:
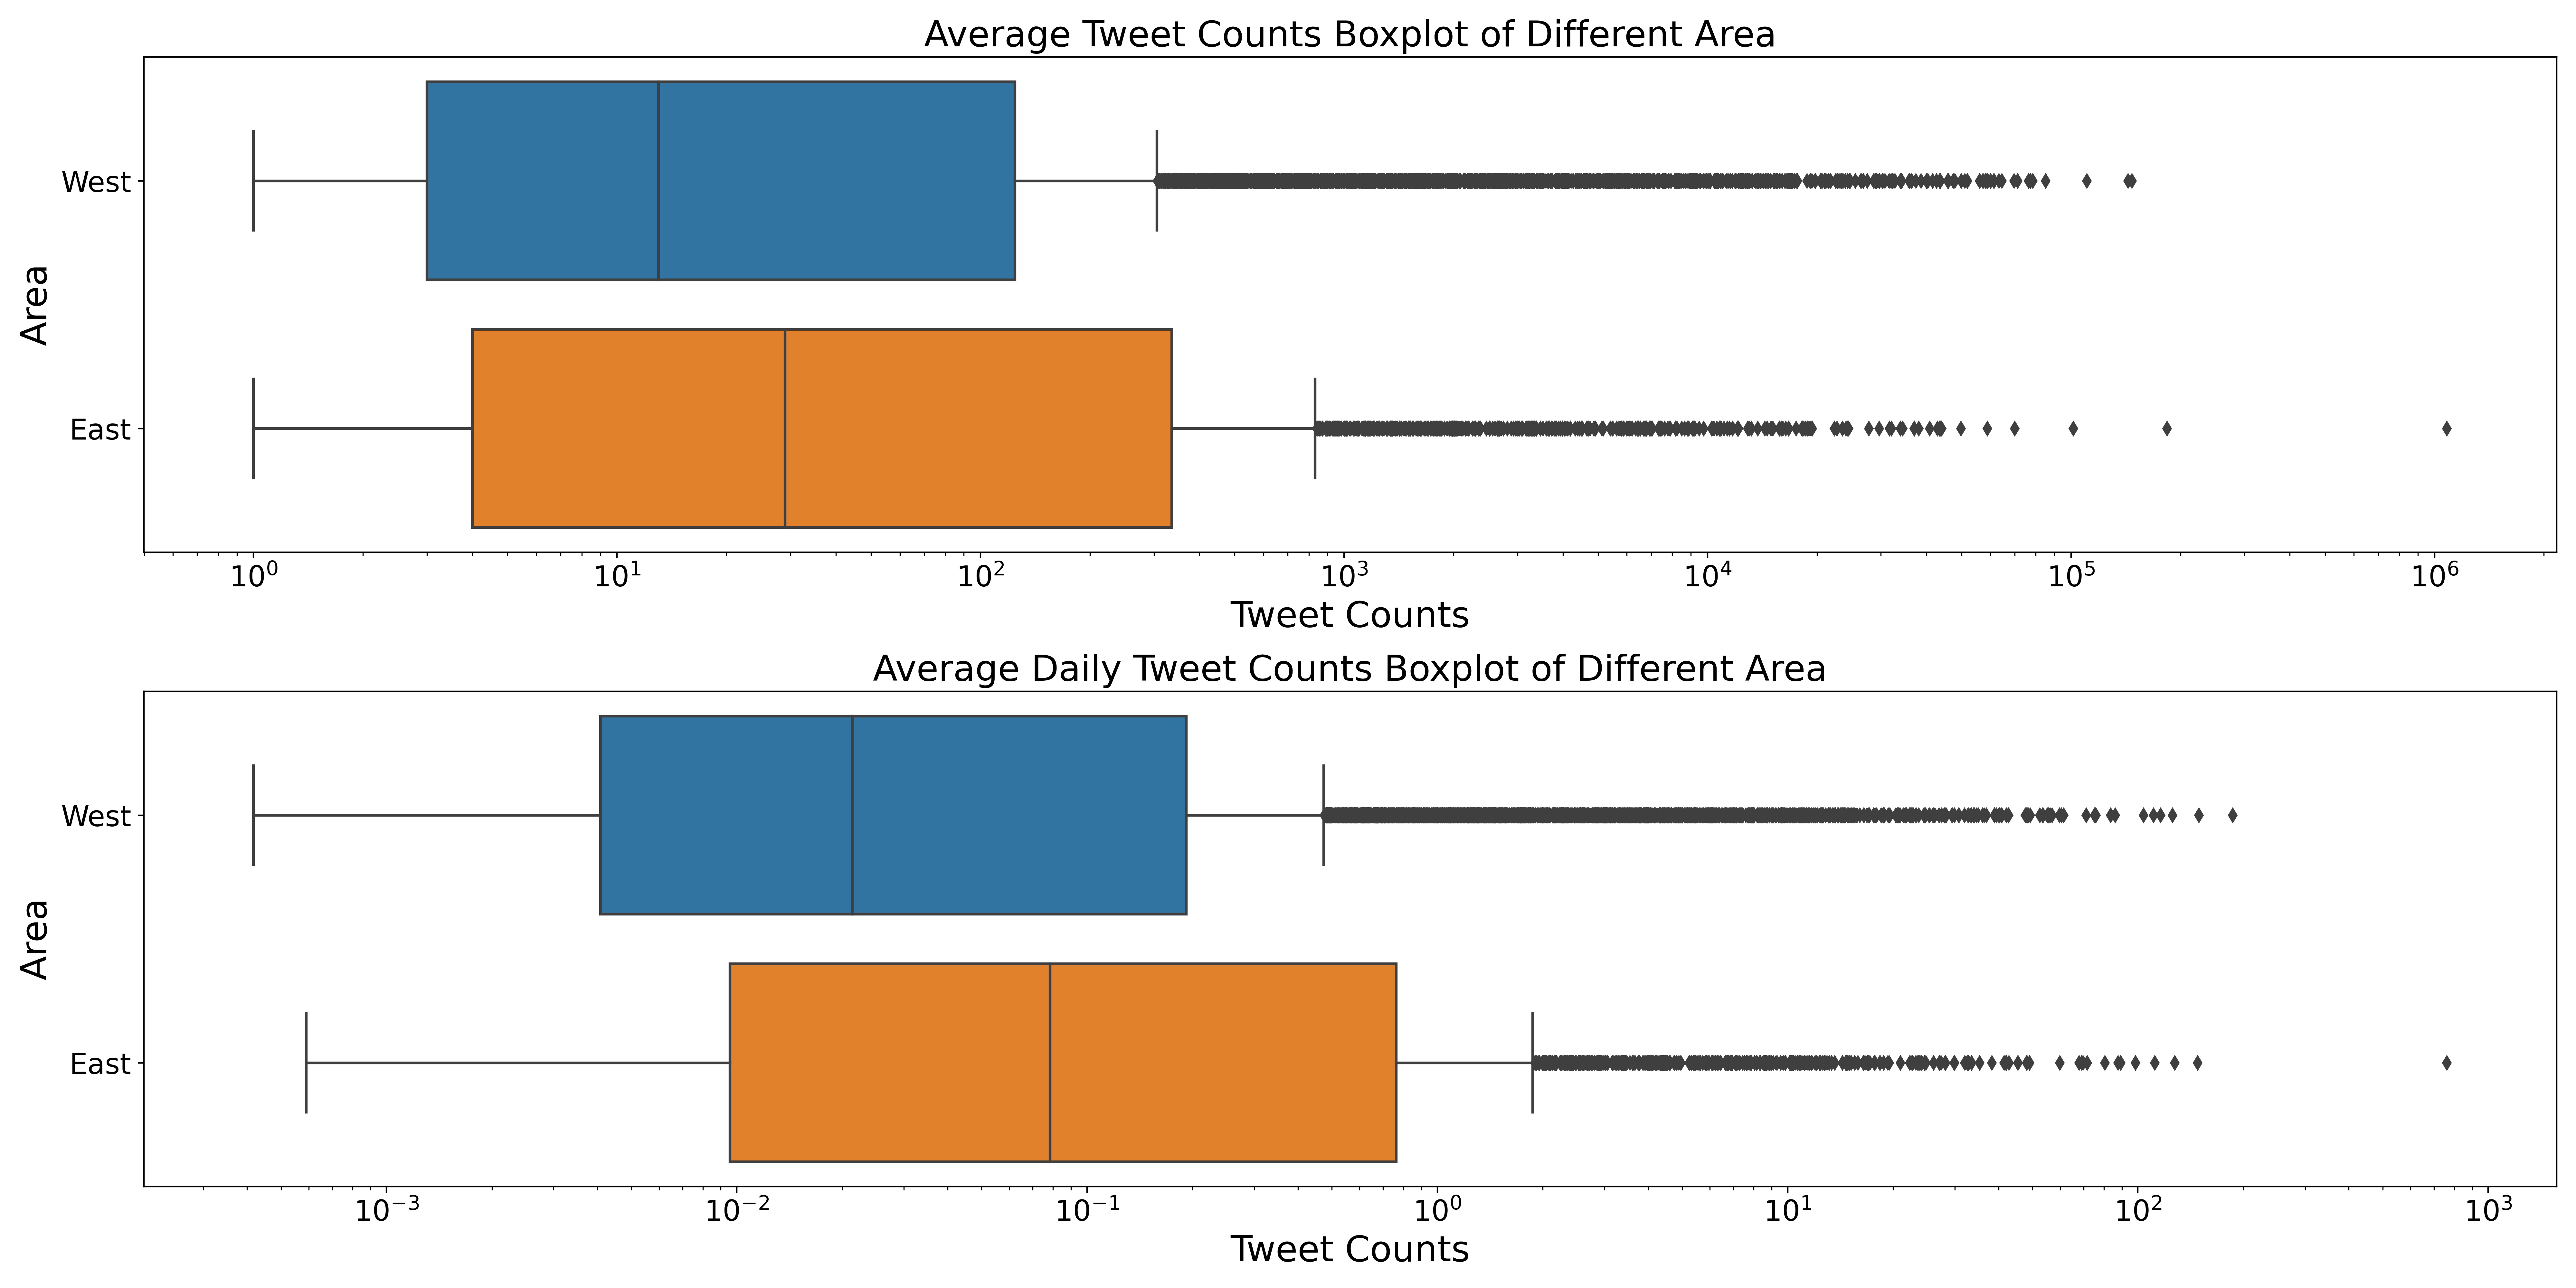
Surprisingly again, eastern culture users have higher activeness than the western culture users on Twitter.